


Next: Absolute AB magnitudes
Up: Conversion of various units
Previous: Conversion of various units
Continuum fluxes
Converting between photon flux, energy flux and magnitudes is not
readily obvious. Some useful formulas to remember are:
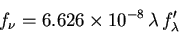 |
(1) |
and;
 |
(2) |
where
 is the energy flux measured in
  (Janskys, equivalent to 10-26 W m-2 Hz-1),
-
 is the photon flux measured in
 ,
,
 is the wavelength measured in
 ,
,
-
 is the magnitude scale defined by Oke & Gunn
(1983)1.
is the magnitude scale defined by Oke & Gunn
(1983)1.
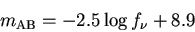
The conversion to standard magnitudes depends on the calibration of
the Vega flux in different wavelength bands. An example is shown in
Table 1 for the Johnson-Cousins-Glass system from
Bessell (1992)2. Examples of
monochromatic flux conversions are shown in
Table 2, where the Vega magnitudes are
approximated using a fit to the calibrations in
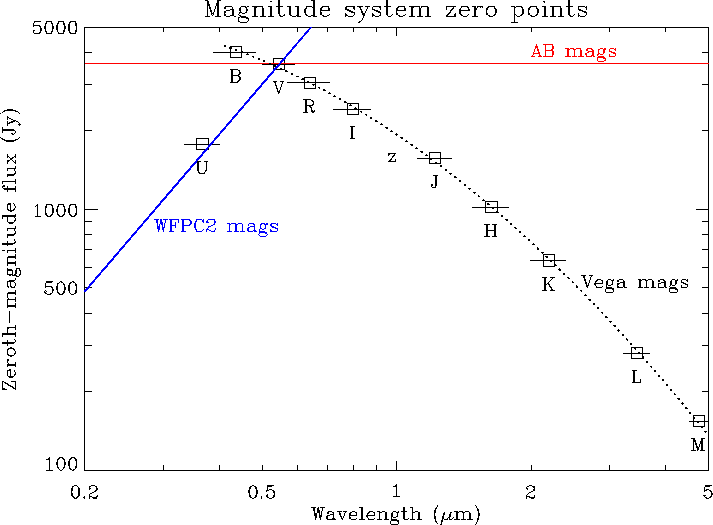
Table 1 (see also Figure 1).
A further system used for the WFPC2 filters is based on the following
formula
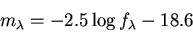 |
(3) |
where
 is the flux meaured in
 .
The conversion to AB magnitudes is given by
3
.
The conversion to AB magnitudes is given by
3
 |
(4) |
where
is the wavelength measured in
.
As with Vega magnitudes, the zero points of AB and WFPC2 magnitudes
are the same around 0.55
(the V band).
Figure 1 shows the relationship between these
different magnitude systems from 0.2 to 5.0
.
Table 1:
Zero points for the Johnson-Cousins-Glass photometric system,
normalized to Vega
| band |
B |
V |
R |
I |
J |
H |
K |
L |
M |
| effective wavelength (
) |
0.436 |
0.545 |
0.638 |
0.797 |
1.22 |
1.63 |
2.19 |
3.45 |
4.75 |
| zeroth mag flux (Jy) |
4000 |
3600 |
3060 |
2420 |
1570 |
1020 |
636 |
281 |
154 |
| AB mag − Vega mag |
−0.1 |
0.0 |
0.2 |
0.45 |
0.9 |
1.4 |
1.9 |
2.8 |
3.4 |
Table 2:
Monochromatic flux conversions in the near infrared
| band |
wavelength |
photon flux |
energy flux |
AB mag |
Vega mag |
| |
(
) |
(
) |
(
 ) ) |
|
|
| z |
1.00 |
1000 |
66.3 |
19.3 |
18.7 |
| J |
1.25 |
1000 |
82.8 |
19.1 |
18.1 |
| H |
1.65 |
1000 |
109.3 |
18.8 |
17.4 |
| K |
2.20 |
1000 |
145.8 |
18.5 |
16.6 |
Figure:
The squares represent the zeroth-magnitude fluxes of the standard
broad-band photometric system, effectively the low resolution
(
 )
spectrum of an A0 star (Vega). The black solid
lines show the approximate wavelength range for each band; the
dotted line is a fit to the B to M fluxes; the red solid line
shows the AB magnitude zero point, and; the blue solid line shows
the zero points for a system based on
)
spectrum of an A0 star (Vega). The black solid
lines show the approximate wavelength range for each band; the
dotted line is a fit to the B to M fluxes; the red solid line
shows the AB magnitude zero point, and; the blue solid line shows
the zero points for a system based on
 .
.
 |
Next: Absolute AB magnitudes
Up: Conversion of various units
Previous: Conversion of various units
Ivan Baldry
2003-03-20