Comparison between ResultsZone and SquashLevels ranking
The following tables and plot compare the
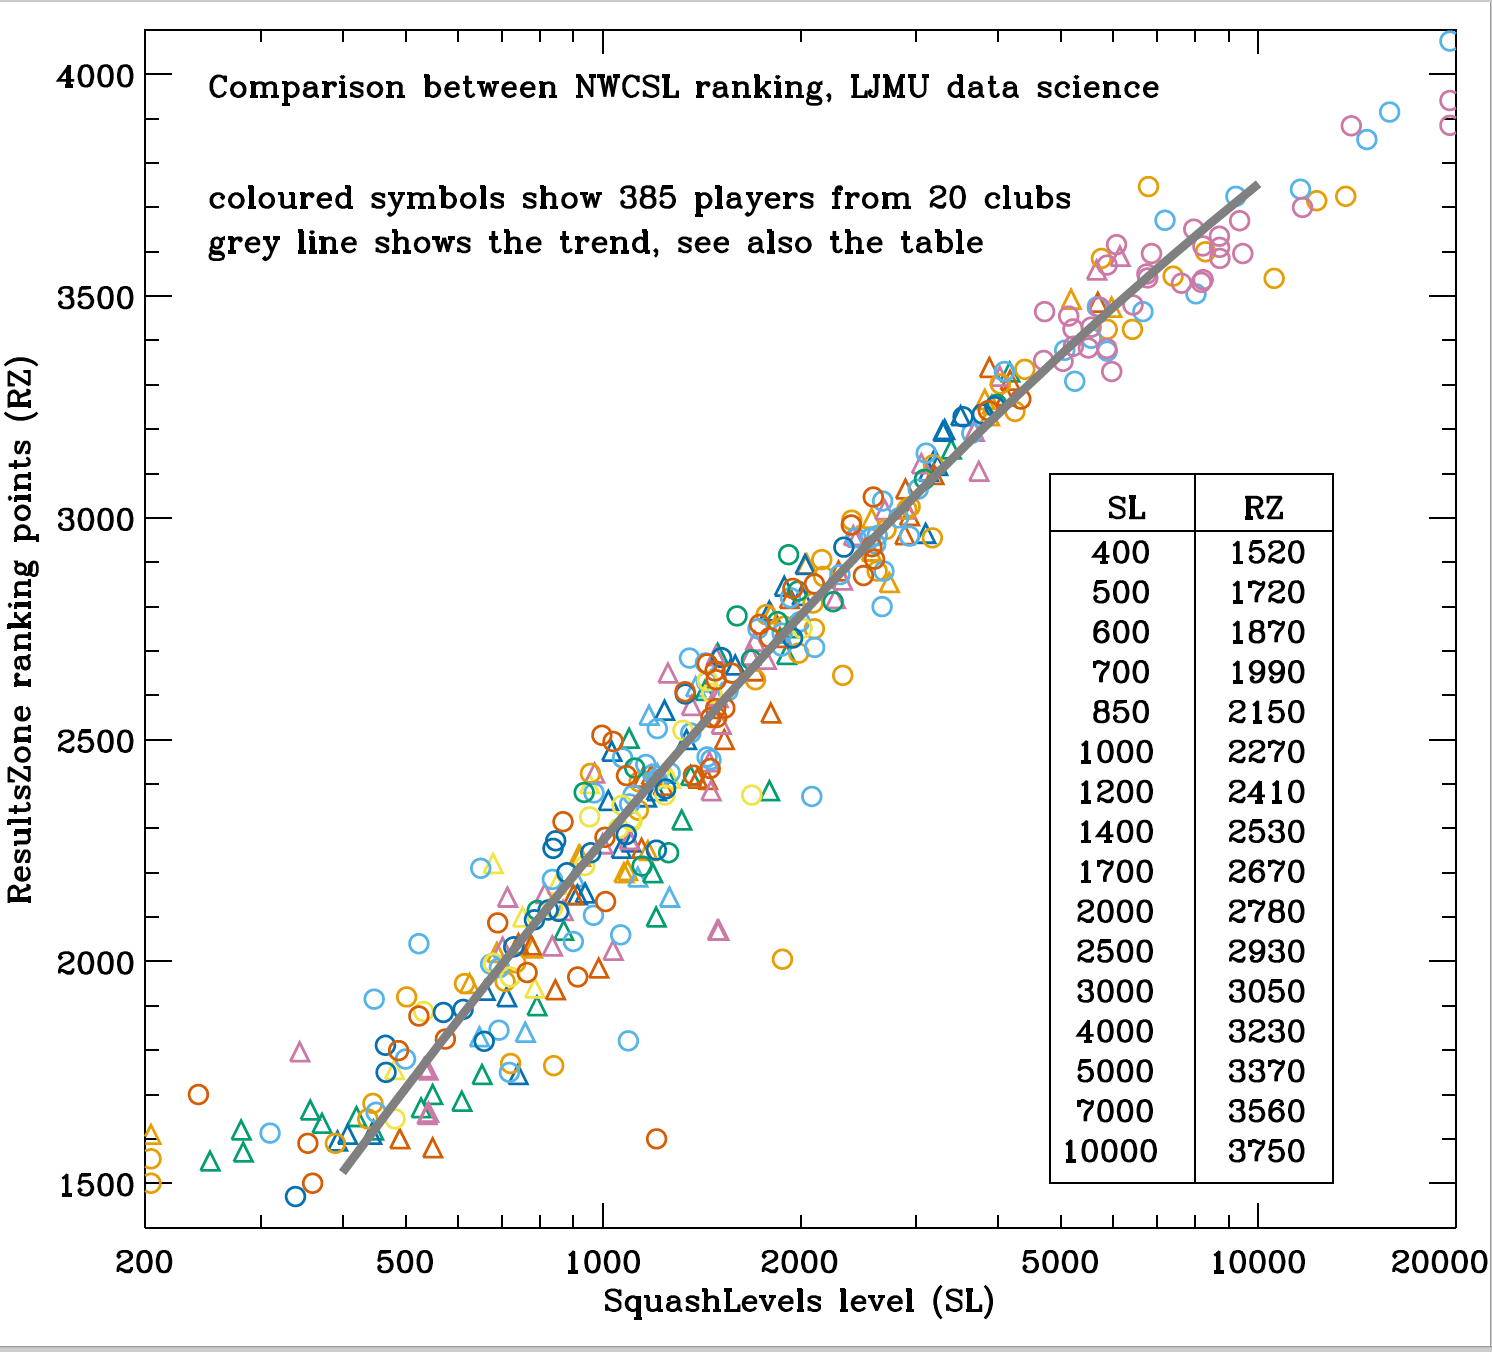
ranking points from ResultsZone (RZ) with the
level from SquashLevels (SL) for the
North West Counties Squash League (NWCSL) at mid 2018.
The data were obtained from about twenty clubs in Merseyside and Cheshire.
A trend was determined and used to produce the tables.
The tables also show the percentage change in SL level that is equivalent to 100 points in RZ.
| RZ points | SL level | SL % change |
| 1000 | 215 | 12.4 |
| 1100 | 245 | 12.4 |
| 1200 | 275 | 12.4 |
| 1300 | 310 | 12.4 |
| 1400 | 345 | 12.4 |
| 1500 | 390 | 12.4 |
| 1600 | 440 | 12.4 |
| 1700 | 490 | 12.5 |
| 1800 | 550 | 12.8 |
| 1900 | 620 | 13.0 |
| 2000 | 710 | 13.2 |
| 2100 | 800 | 13.5 |
| 2200 | 900 | 13.7 |
| 2300 | 1040 | 14.0 |
| 2400 | 1180 | 14.3 |
| 2500 | 1360 | 14.6 |
|
|
| RZ points | SL level | SL % change |
| 2600 | 1560 | 14.9 |
| 2700 | 1780 | 15.2 |
| 2800 | 2060 | 15.6 |
| 2900 | 2400 | 16.0 |
| 3000 | 2750 | 16.5 |
| 3100 | 3250 | 16.9 |
| 3200 | 3800 | 17.4 |
| 3300 | 4500 | 18.0 |
| 3400 | 5300 | 18.7 |
| 3500 | 6300 | 19.3 |
| 3600 | 7500 | 20.0 |
| 3700 | 9000 | 20.5 |
| 3800 | 11000 | 20.5 |
| 3900 | 13200 | 20.5 |
| 4000 | 15800 | 20.5 |
| 4100 | 19000 | 20.5 |
|
|
The SL rankings are much more spread out compared to RZ at the high end.
This is because SL works with ratios so that a percent change in SL
corresponds to a fixed change in RZ. Even taking account of this, a
difference of 100 points in RZ, corresponds to a difference of about 12% in
SL at the low end but corresponds to 20% at the high end. This may be in
part because the lower divisions use PARS to 15 while the higher divisions
use PARS to 11. An unexpected win is more difficult in PARS to 15 compared
to PARS to 11; thus RZ, which only uses win/loss to assign points, is more
spread out for the lower divisions. RZ also changes its method of assigning
points slightly at the high end. Neither system will be perfectly in sync
across different divisions, and across tournament players in the case of SL.
Analysis and page by Ivan Baldry, programme leader for
MSc Data Science at LJMU.