
Figures and text from Appendix of paper published in A&A, Vol. 482, p. 507.
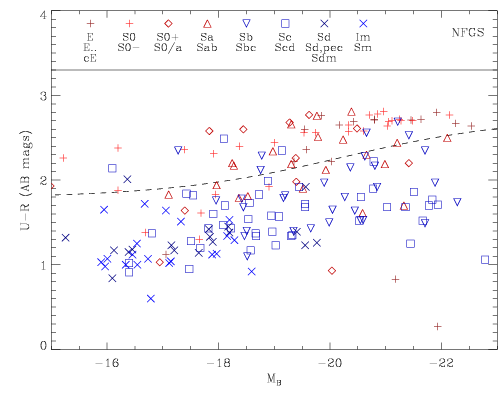
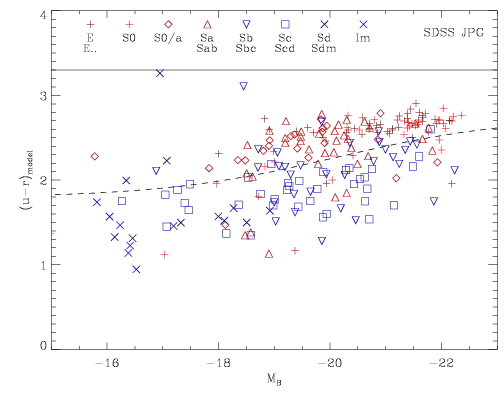
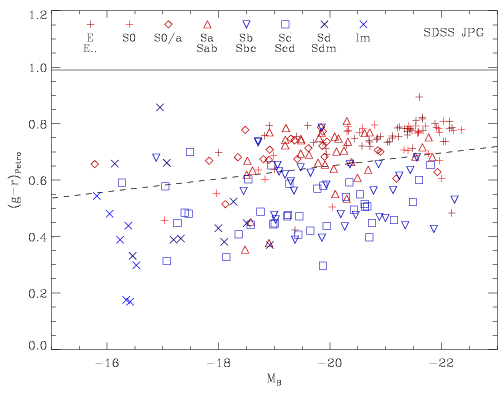
Galaxies divide naturally into a red and blue sequence when viewed in a colour-magnitude diagram (CMD) using u-r, g-r colours or similar (Blanton et al. 2003, Baldry et al. 2004). In order to outline the connection between traditional morphological classification using the E-S0-Sa-Sd-Im scheme and the colour sequences, we used data from the Nearby Field Galaxy Survey (NFGS; Jansen et al. 2000) and the SDSS Japanese Participation Group (JPG) catalogue (Fukugita et al. 2007). The figures show CMD for these data with different symbols representing morphological classification in eight groups. The dashed lines represent dividing lines determined from a larger SDSS sample.

|

|

|
The fraction of galaxies
on the blue sequence (fb) for the eight morphological groups
is given in the table:
|
See paper for details.
Links: - return to my home page; return to my research page; list of publications.