More on the Cosmic Spectrum: Beyond the Visible
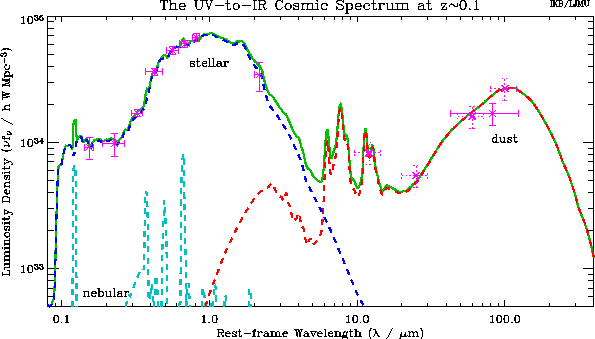
The figure below shows the ultraviolet to infrared cosmic spectrum.
The pink crosses represent the data while the lines represent model
spectra. The blue line represents the stellar component, the cyan
line the nebular component, the red line the dust component and the
green line the total spectrum. Note that the active galactic nucleus
(black hole accretion) contribution is not shown (expected to be
small). The models are from Fioc & Rocca-Volmerage (1997; PEGASE) for
the stellar and nebular emission and Dale & Helou (2002) for the dust
emission. The data are from Budavari et al. (2005) for the 0.1-0.3 micron
measurements, Blanton et al. (2003) for 0.3-1.0 microns, Cole et
al. (2001) and Kochanek et al. (2001) for 2.2 microns, Saunders et
al. (1990) for the 42-122 micron band and Soifer & Neugebauer (1991)
for the other four IR measurements. The best fit model spectrum was
obtained using analysis similar to that of Baldry & Glazebrook (2003).
Ivan Baldry, written 2003 October 23rd, updated 2005 October 13th.

